|
measuring the PowerPC 604e, and XL C against GCC [ home | fractals | archaeology | language model | chess | neural net ] Why. The fractal renderer told me how fast one floating-point kernel runs here, which is not the same as understanding the machine. So I wrote a small microbenchmark suite and ran it on obsidian under several compilers and flag combinations, then drew the charts on obsidian too - with the same GIF encoder, and a bitmap font generated from a system TTF.
Method. Integer and basic floating-point benchmarks are dependent chains (each operation feeds the next), so they measure latency; operands come from a small table so the loops cannot be folded or removed. The transcendental and branch benchmarks are independent (throughput). Each result is the best of 5 runs after auto-calibration to about 0.2 s of CPU time, timed with clock(). Compilers: XL C 5.0.2 (-qlanglvl=ansi) and GCC 2.95.3 (-ansi), at -O0, -O2 and -O3, with and without -qarch=604 -qtune=604 / -mcpu=604. 1. Optimisation matters far more than the compiler At -O0 both compilers emit literal, naive code. Turning on -O2 is worth roughly six to eight times on the tight loops, and it is by far the largest single effect measured. 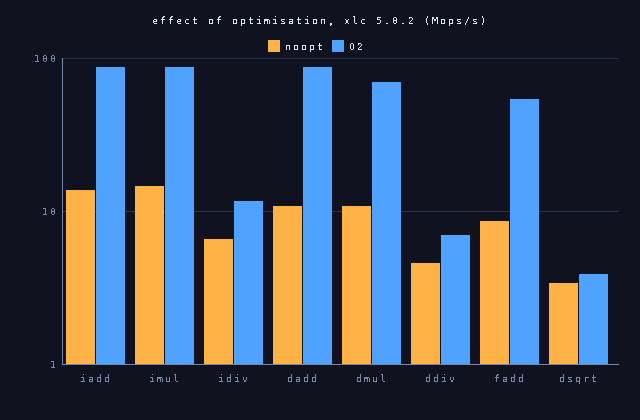 bars are on a logarithmic axis; note the relative heights, not the linear gaps
2. XL C versus GCC at -O2, tuned for the 604 At equal optimisation the two are close, and neither dominates. XL C is clearly ahead on floating point (dadd 88 vs 63, dmul 70 vs 63, fadd 54 vs 46 Mops/s) and on 64-bit multiply; GCC is ahead on integer add and on the unpredictable branch. Integer divide and the libm transcendentals are identical, because they are the same slow instructions and library routines underneath. 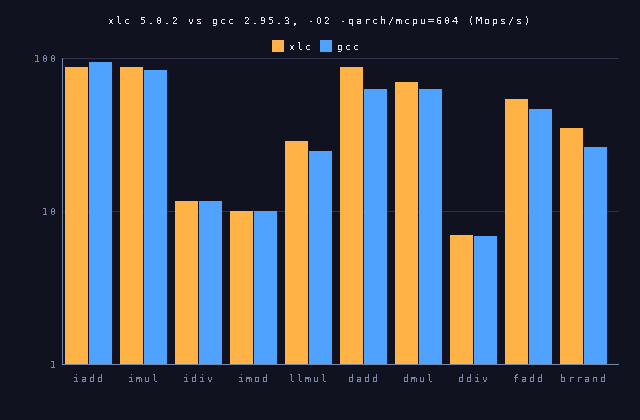 logarithmic axis, Mops/s; idiv/ddiv are an order of magnitude slower than add/multiply
The fastest chains reach about 88 Mops/s; at 250 MHz that is roughly 2.8 cycles per operation - one dependent add or multiply plus its cached operand load. Floating-point divide is an order of magnitude slower (about 7 Mops/s, tens of cycles), as expected for the 604e. One surprise: GCC -O3 is slower than -O2 here on several integer and FP chains (iadd 65 vs 95 Mops/s). Whatever it gains, it loses more; on this target -O2 is the better GCC setting. XL C showed no such regression. 3. The memory hierarchy Sequential bandwidth holds at about 336 MB/s while the working set fits in the 32 KB L1 data cache, then drops as it spills into the 1 MB L2 and finally into main memory. Writes fall further than reads. A pointer-chase through a shuffled index array shows the same steps as latency: about 10 ns in L1, 50 ns in L2, and 250 to 330 ns once the chain leaves the caches and has to reach DRAM - the stepwise cache hierarchy of the era. At 250 MHz (one cycle every 4 ns) those are roughly 2.5, 12 and 62 to 83 cycles. 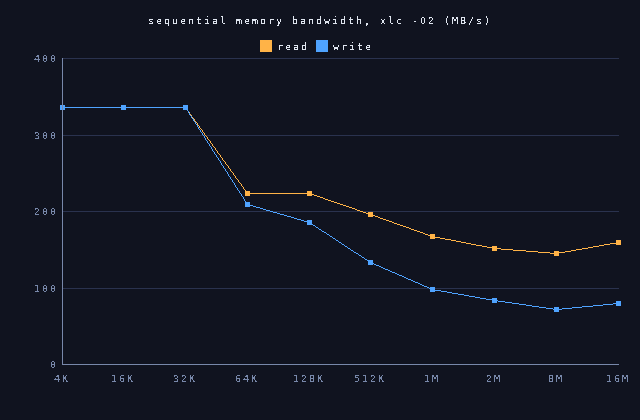 sequential read/write bandwidth versus working-set size 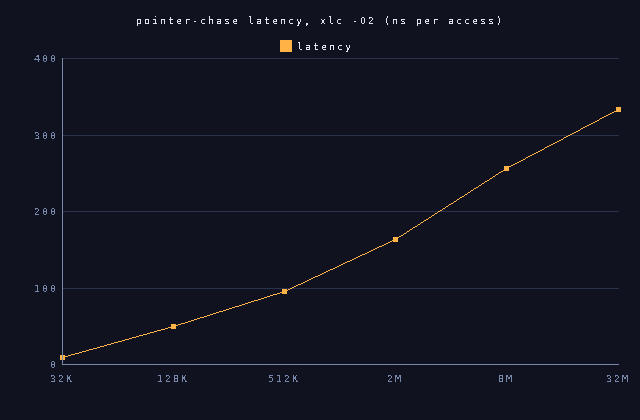 dependent-load latency versus working-set size
What this is not These are dependent-chain measurements, so they report latency, not peak throughput, and each integer/FP iteration also includes one table load from cache. Only one run sequence was taken (best of 5); no confidence intervals are claimed. The 250 MHz clock is the system's rated speed; this AIX build does not expose it, so it was supplied rather than measured - it affects only the cycle figures above, never the measured throughputs or latencies. The charts were rendered by my own GIF encoder - a deliberate choice, but one that means axis labels are drawn with a generated bitmap font rather than a text engine. Files
Sources: bench.c,
chart.c,
gifenc.c,
font.h (generated),
run.sh,
Makefile. |